Market Outlook
June 1, 2017
Market Cues
Domestic Indices
Chg (%)
(Pts)
(Close)
Indian markets are likely to open on Flat to negative note tracking the SGX Nifty and
BSE Sensex
(0.0)
(14)
31,146
Global markets.
Nifty
(0.0)
(3)
9,621
U.S. stocks closed lower, as Financials took a hit because two of the largest U.S.
Mid Cap
0.9
136
14,625
banks signaled signs of a trading slowdown. Throughout the session market remain
Small Cap
1.0
156
15,080
under pressure owing to news reports that former FBI Director James Comey will
publicly testify that President Donald Trump, and President Donald Trump has
Bankex
0.5
145
26,547
decided to withdraw from the Paris climate accord.
Global Indices
Chg (%)
(Pts)
(Close)
The S&P 500 index, fell -0.05% to close at 2,412, The Dow Jones Industrial Average
closed down -0.10% at 21,009.Meanwhile, the Nasdaq Composite Index COMP,
Dow Jones
(0.1)
(21)
21,009
dropped -0.08% at 6,199.
Nasdaq
(0.1)
(5)
6,199
FTSE
(0.1)
4
(7)
7,520
U.K. stocks erased earlier firm gains and ended the session slightly lower, as nerves
ahead of next week’s general election sparked some selling. The FTSE 100 index,
Nikkei
(0.1)
(27)
19,651
fell -0.09% to close at 7,512. For May, the U.K. benchmark ended 4.4% higher, its
Hang Seng
(0.2)
(41)
25,661
biggest monthly advance since December last year.
Shanghai Com
0.2
7
3,117
The Indian Equity benchmarks closed lower on profit booking as investor’s
maintained cautious stance ahead of GDP data. The BSE Sensex ended down 0.04%
Advances / Declines
BSE
NSE
at 31,146 while the broader Nifty index finished lower 0.03 % at 9,621.
Advances
1,384
1,953
Declines
1,301
718
News Analysis
Unchanged
181
70
GDP expands at 7.1% in FY17, but slows to 6.1% in Q4
Detailed analysis on Pg2
Volumes (` Cr)
Investor’s Ready Reckoner
BSE
4,066
Key Domestic & Global Indicators
NSE
39,298
Stock Watch: Latest investment recommendations on 150+ stocks
Refer Pg5 onwards
#Net Inflows (` Cr)
Net
Mtd
Ytd
Top Picks
FII
(5(172)
(28,825
50,837
CMP
Target
Upside
Company
Sector
Rating
MFs
8449
8,960
29,642
(`)
(`)
(%)
Blue Star
Capital Goods
Buy
633
760
20.1
Dewan Housing Fin. Financials
Buy
417
520
24.6
Top Gainers
Price (`)
Chg (%)
Mahindra Lifespace Real Estate
Buy
427
522
22.4
Prestige
248
10.4
Navkar Corporation Others
Buy
218
265
21.3
Unitdspr
2,267
8.5
KEI Industries
Capital Goods
Accumulate
219
239
9.1
M&Mfin
359
8.2
More Top Picks on Pg3
Gsfc
131
7.1
Key Upcoming Events
Sparc
310
6.6
Previous
Consensus
Date
Region
Event Description
Reading
Expectations
Jun 01, 2017 Germany PMI Manufacturing
59.40
59.40
Top Losers
Price (`)
Chg (%)
Jun 01, 2017 US
Initial Jobless claims
234.00
238.00
Recltd
193
(6.1)
Jun 01, 2017 UK
PMI Manufacturing
57.30
56.50
Videoind
41
(4.9)
Jun 02, 2017 Germany PMI Services
55.20
Sintex
27
(4.7)
Jun 02, 2017 US
Change in Nonfarm payrolls
211.00
180.00
Jun 06, 2017 US
Unnemployment rate
4.40
4.40
Unitech
5
(4.3)
More Events on Pg4
Hathway
40
(4.3)
#As on 31st May 2017
Market Outlook
June 1, 2017
News Analysis
GDP expands at 7.1% in FY17, but slows to 6.1% in Q4
The Ministry of Statistics and Program Implementation (MOSPI) announced its Q4
GDP estimates and its full year GDP estimates for the fiscal year 2016-17 on May
31st. The real GDP for the fourth quarter expanded at 6.1% as against market
estimates of 7.1%. The Gross Value Added (GVA) expanded at 5.6% versus market
estimates of 6.7%. The GVA is the GDP figure excluding the impact of indirect
taxes and hence gives a more realistic picture of growth in production.
For the financial year 2016-17, the growth in real GDP came in at 7.1%, which
was largely along expected lines. This was more due to the lag effect of the
demonetization and the consequent liquidity crunch in the economy. GVA for the
full year stood at 6.6%, which was largely along expected lines. Within the overall
GDP matrix, the growth push came from public administration, defence and other
government services which grew at over 11%, which means that government
spending is still driving growth. Agriculture growth at around 4.9% was actually the
redeeming feature of the GDP numbers, while manufacturing growth at 7.9%
showed green-shoots of recovery.
Economic and Political News
Petrol price hiked by `1.23 a litre, diesel by 89 paise
Govt looks to rejig Air India debt to sweeten deal for buyer
Corporate News
Maruti Suzuki to bring fleet of SUVs to battlefront
Vedanta hopes for Lanjigarh expansion nod by 2020
REC says over 10% lending this financial year will be in renewables
Market Outlook
June 1, 2017
Top Picks
Market Cap
CMP
Target
Upside
Company
Rationale
(` Cr)
(`)
(`)
(%)
Strong growth in domestic business due to its leadership
in acute therapeutic segment. Alkem expects to launch
Alkem Laboratories
23,094
1,932
2,161
11.9
more products in USA, which bodes for its international
business.
We expect the company would report strong profitability
Asian Granito
1,127
374
405
8.2
owing to better product mix, higher B2C sales and
amalgamation synergy..
Favourable outlook for the AC industry to augur well for
Cooling products business which is out pacing the market
Blue Star
6,048
633
760
20.1
growth. EMPPAC division's profitability to improve once
operating environment turns around..
With a focus on the low and medium income (LMI)
consumer segment, the company has increased its
Dewan Housing Finance
13,078
417
520
24.6
presence in tier-II & III cities where the growth opportunity
is immense.
Strong loan growth backed by diversified loan portfolio
and adequate CAR. ROE & ROA likely to remain decent
Equitas Holdings
5,281
156
235
50.4
as risk of dilution remains low. Attractive valuations
considering growth.
Economic recovery to have favourable impact on
advertising & circulation revenue growth. Further, the
Jagran Prakashan
5,875
180
225
25.2
acquisition of a radio business (Radio City) would also
boost the company's revenue growth.
High order book execution in EPC segment, rising B2C
KEI Industries
1,700
219
239
9.1
sales and higher exports to boost the revenues and
profitability
Speedier execution and speedier sales, strong revenue
Mahindra Lifespace
2,189
427
522
22.4
visibilty in short-to-long run, attractive valuations
Massive capacity expansion along with rail advantage at
Navkar Corporation
3,115
218
265
21.3
ICD as well CFS augurs well for the company
Market leadership in Hindi news genre and no.
2
viewership ranking in English news genre, exit from the
TV Today Network
1,569
263
344
30.8
radio business, and anticipated growth in ad spends by
corporates to benefit the stock.
Source: Company, Angel Research
Market Outlook
June 1, 2017
Key Upcoming Events
Global economic events release calendar
Bloomberg Data
Date
Time
Country
Event Description
Unit
Period
Last Reported
Estimated
Jun 01, 2017
1:25 PM
Germany
PMI Manufacturing
Value
May F
59.40
59.40
6:00 PM
US
Initial Jobless claims
Thousands
May 27
234.00
238.00
2:00 PM
UK
PMI Manufacturing
Value
May
57.30
56.50
Jun 02, 2017
1:25 PM
Germany
PMI Services
Value
May F
55.20
6:00 PM
US
Change in Nonfarm payrolls
Thousands
May
211.00
180.00
Jun 06, 2017
6:00 PM
US
Unnemployment rate
%
May
4.40
4.40
Jun 07, 2017
2:30 PM
Euro Zone
Euro-Zone GDP s.a. (QoQ)
% Change
1Q F
0.50
2:30 PM
India
RBI Reverse Repo rate
%
Jun 7
6.00
6.00
2:30 PM
India
RBI Repo rate
%
Jun 7
6.25
6.25
2:30 PM
India
RBI Cash Reserve ratio
%
Jun 7
4.00
4.00
Jun 08, 2017
China
Exports YoY%
% Change
May
8.00
5:15 PM
Euro Zone
ECB announces interest rates
%
Jun 8
-
Jun 09, 2017
2:00 PM
UK
Industrial Production (YoY)
% Change
Apr
1.40
7:00 AM
China
Consumer Price Index (YoY)
% Change
May
1.20
1.40
Jun 12, 2017
5:30 PM
India
Industrial Production YoY
% Change
Apr
2.70
Jun 13, 2017
US
Producer Price Index (mom)
% Change
May
0.60
2:00 PM
UK
CPI (YoY)
% Change
May
2.70
Jun 14, 2017
India
Imports YoY%
% Change
May
49.10
India
Exports YoY%
% Change
May
19.80
2:00 PM
UK
Jobless claims change
% Change
May
19.40
7:30 AM
China
Industrial Production (YoY)
% Change
May
6.50
6:00 PM
US
Consumer price index (mom)
% Change
May
0.20
-
12:00 PM
India
Monthly Wholesale Prices YoY%
% Change
May
3.85
11:30 PM
US
FOMC rate decision
%
Jun 14
1.00
1.25
Jun 15, 2017
6:45 PM
US
Industrial Production
%
May
0.98
0.20
2:30 PM
Euro Zone
Euro-Zone CPI (YoY)
%
May F
1.40
Source: Bloomberg, Angel Research
Market Outlook
June 1, 2017
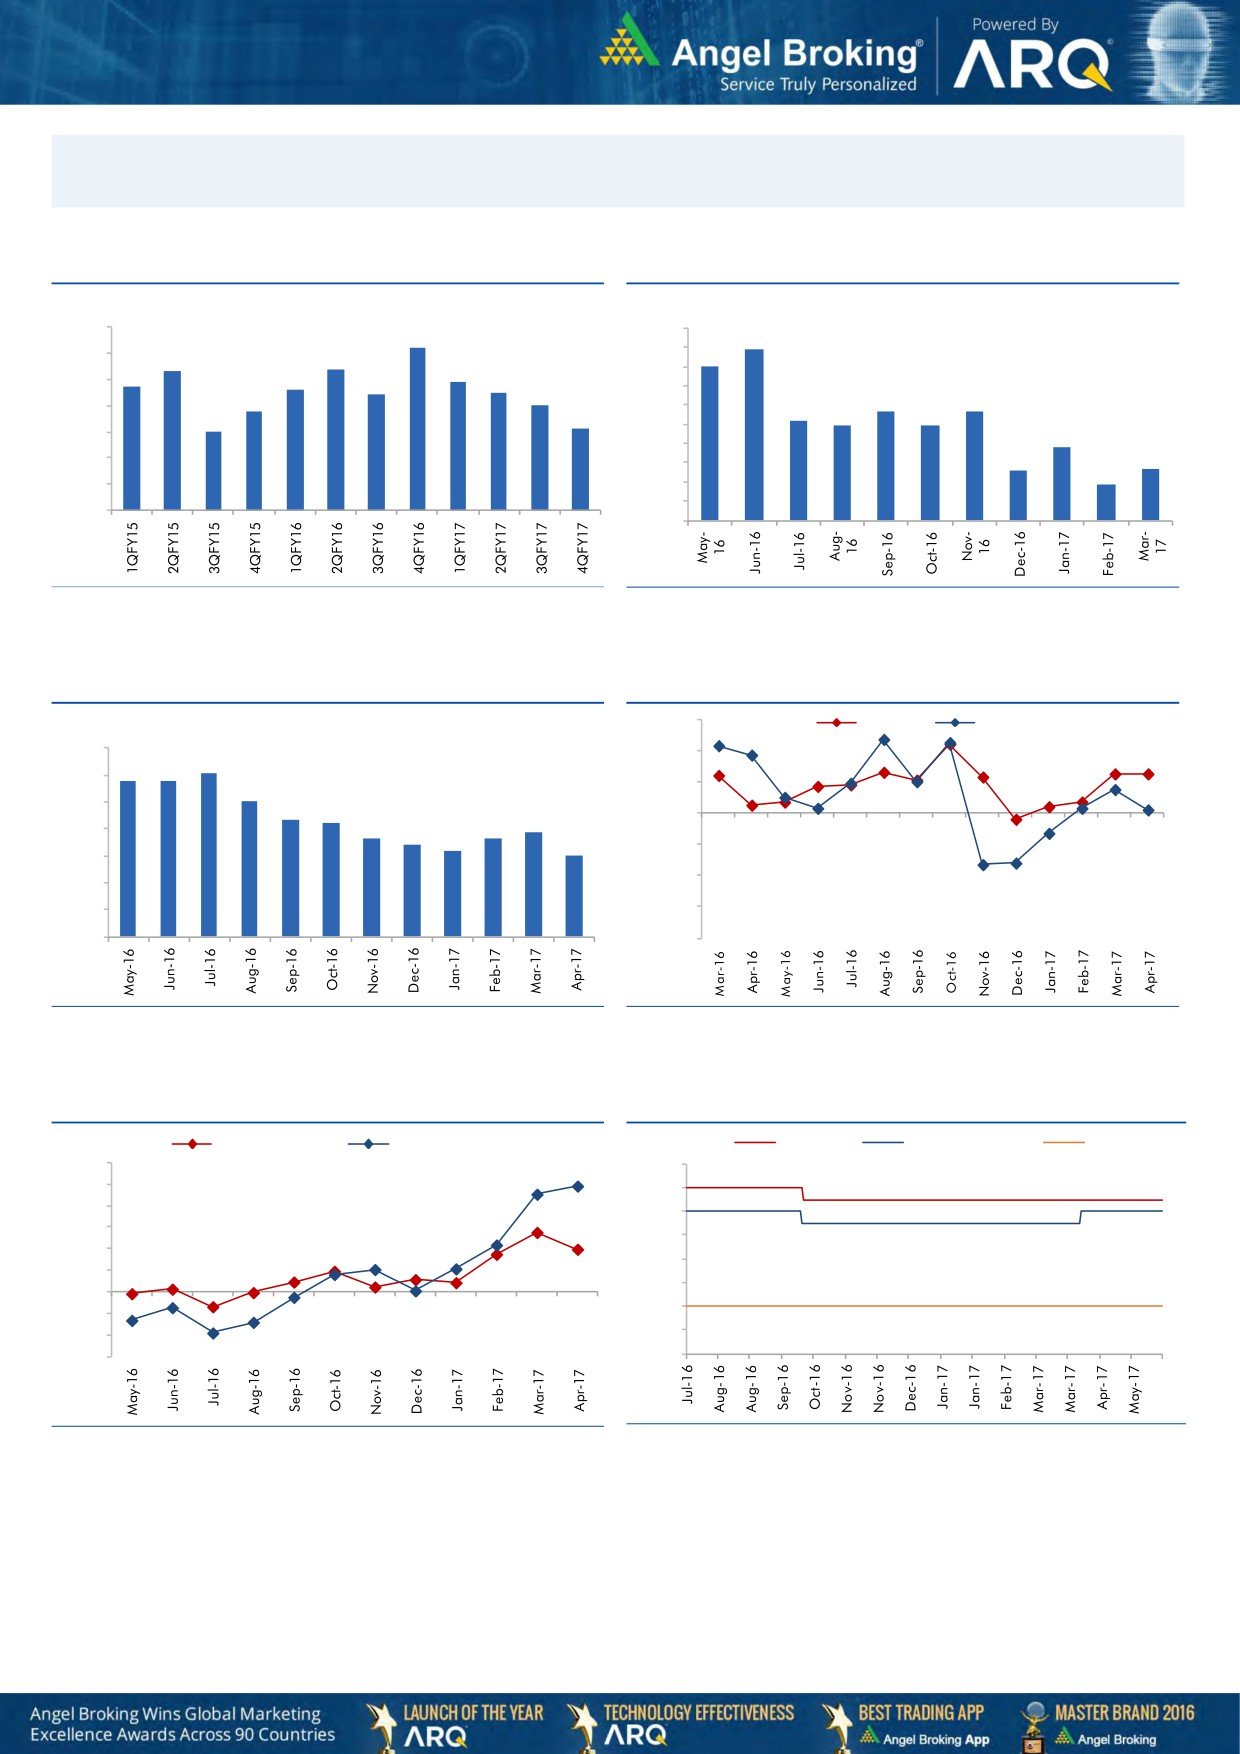
Macro watch
Exhibit 1: Quarterly GDP trends
Exhibit 2: IIP trends
(%)
(%)
10.0
9.2
10.0
8.9
9.0
8.3
8.4
9.0
8.0
7.9
8.0
7.7
7.6
8.0
7.4
7.5
7.0
7.0
6.8
5.7
5.7
7.0
6.0
5.2
4.9
4.9
6.0
6.1
5.0
6.0
3.8
4.0
2.6
2.7
5.0
3.0
1.9
4.0
2.0
1.0
3.0
-
Source: CSO, Angel Research
Source: MOSPI, Angel Research
Exhibit 3: Monthly CPI inflation trends
Exhibit 4: Manufacturing and services PMI
56.0
Mfg. PMI
Services PMI
(%)
7.0
54.0
6.1
5.8
5.8
6.0
5.1
52.0
5.0
4.3
4.2
3.9
50.0
3.6
3.7
4.0
3.4
3.2
3.0
48.0
3.0
46.0
2.0
1.0
44.0
-
42.0
Source: MOSPI, Angel Research
Source: Market, Angel Research; Note: Level above 50 indicates expansion
Exhibit 5: Exports and imports growth trends
Exhibit 6: Key policy rates
(%)
Exports yoy growth
Imports yoy growth
(%)
Repo rate
Reverse Repo rate
CRR
60.0
7.00
50.0
6.50
40.0
6.00
30.0
5.50
20.0
5.00
10.0
4.50
0.0
4.00
(10.0)
(20.0)
3.50
(30.0)
3.00
Source: Bloomberg, Angel Research
Source: RBI, Angel Research
Market Outlook
June 1, 2017
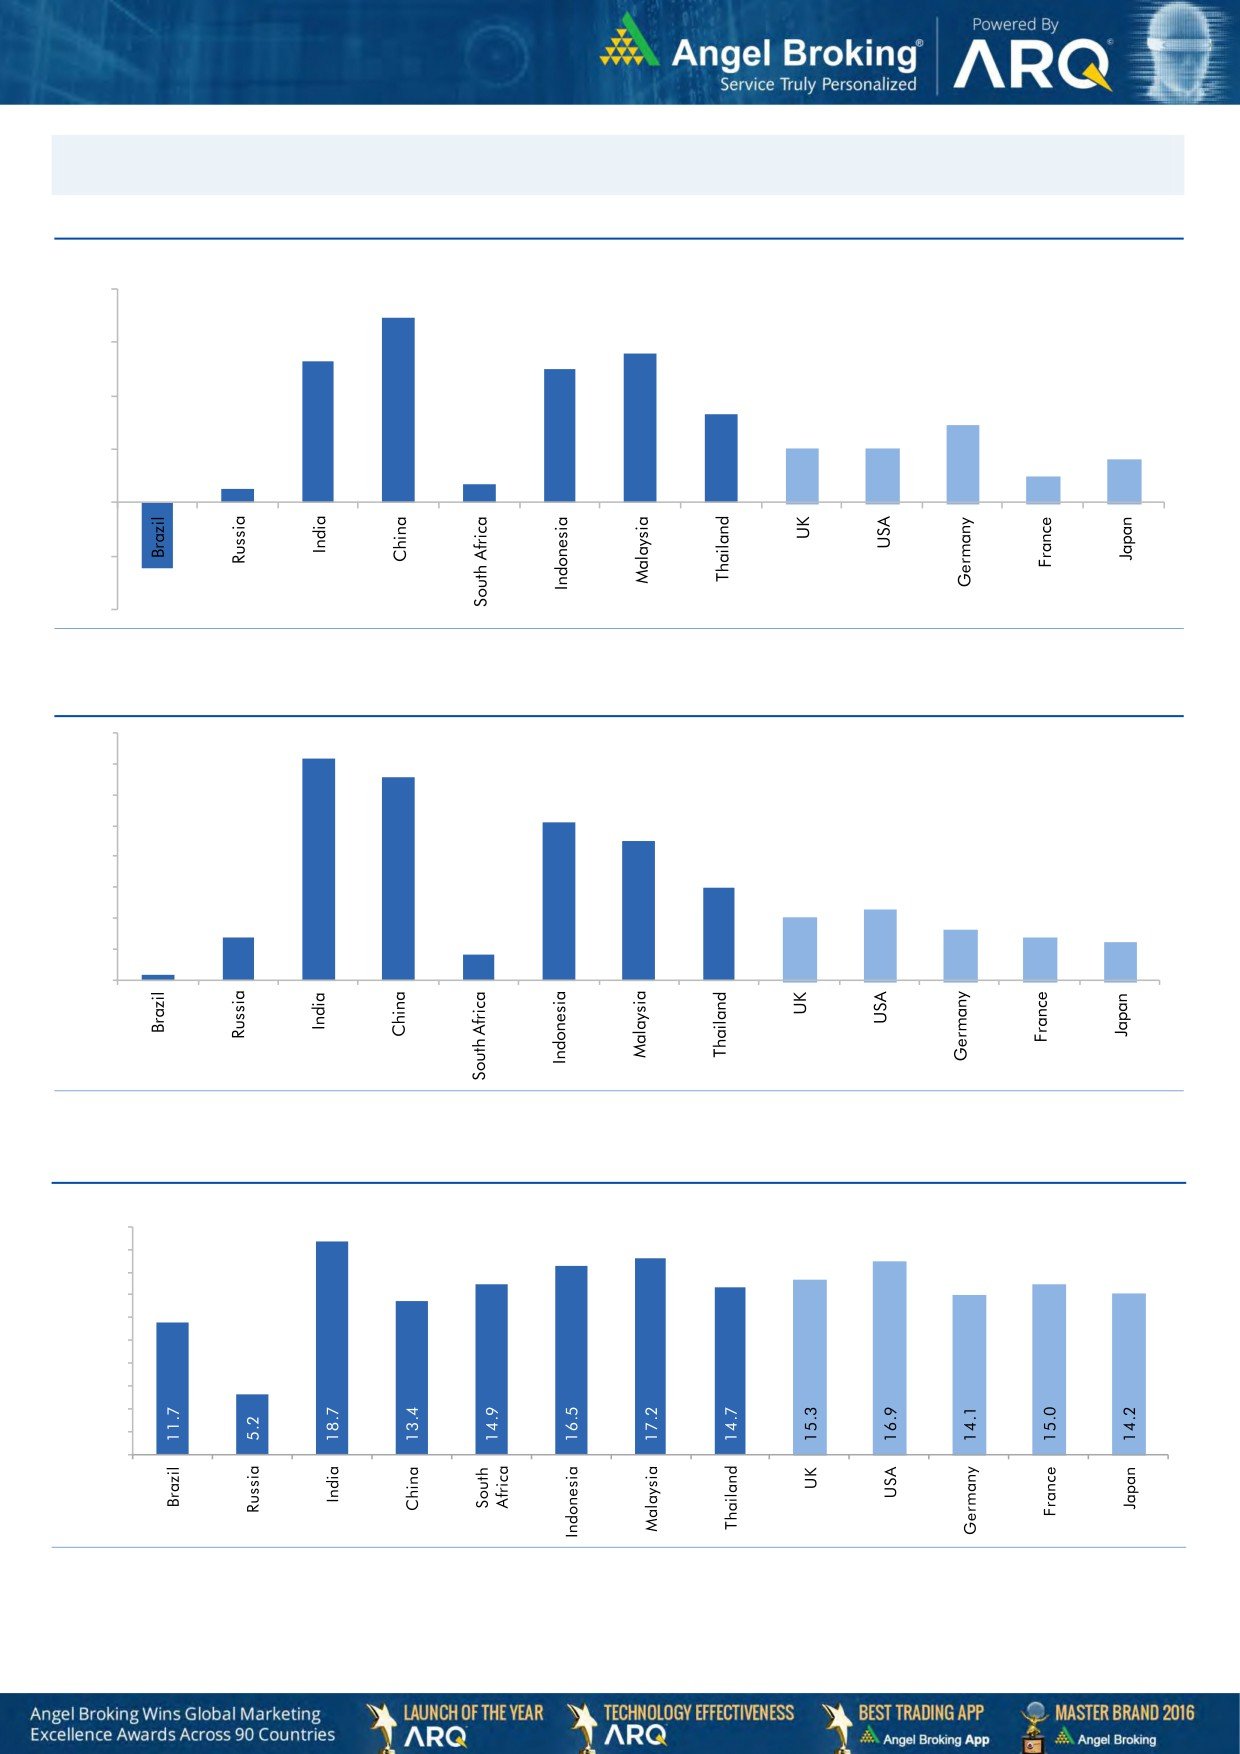
Global watch
Exhibit 1: Latest quarterly GDP Growth (%, yoy) across select developing and developed countries
(%)
8.0
6.9
5.6
6.0
5.3
5.0
0.7
4.0
3.3
2.9
2.0
2.0
0.5
2.0
1.6
1.0
-
(2.0)
(2.5)
(4.0)
Source: Bloomberg, Angel Research
Exhibit 2: 2016 GDP Growth projection by IMF (%, yoy) across select developing and developed countries
(%)
7.2
7.0
6.6
6.0
5.1
5.0
4.5
4.0
3.0
3.0
2.3
2.0
1.4
1.6
2.0
1.4
1.2
0.2
0.8
1.0
-
Source: IMF, Angel Research
Exhibit 3: One year forward P-E ratio across select developing and developed countries
(x)
20.0
18.0
16.0
14.0
12.0
10.0
8.0
6.0
4.0
2.0
-
Source: IMF, Angel Research # as on 29th May 2017
Market Outlook
June 1, 2017
Exhibit 4: Relative performance of indices across globe
Returns (%)
Country
Name of index
Closing price
1M
3M
1YR
Brazil
Bovespa
62,711
(4.1)
(7.0)
28.1
Russia
Micex
1,900
(6.2)
(9.2)
0.5
India
Nifty
9,621
3.4
7.6
19.2
China
Shanghai Composite
3,117
(1.5)
(4.6)
10.6
South Africa
Top 40
47,154
0.2
4.5
(1.9)
Mexico
Mexbol
48,788
(1.0)
3.7
7.1
Indonesia
LQ45
958
0.7
8.1
19.4
Malaysia
KLCI
1,766
(0.1)
4.3
8.6
Thailand
SET 50
986
(0.9)
0.4
11.8
USA
Dow Jones
21,009
0.3
0.9
18.1
UK
FTSE
7,520
3.9
3.8
21.6
Japan
Nikkei
19,651
1.9
1.9
19.1
Germany
DAX
12,615
1.4
6.7
22.6
France
CAC
5,284
0.3
9.0
18.8
Source: Bloomberg, Angel Research
Stock Watch
June 01, 2017
Company Name
Reco
CMP
Target
Mkt Cap
Sales ( Čcr )
OPM(%)
EPS (Č)
PER(x)
P/BV(x)
RoE(%)
EV/Sales(x)
(Č)
Price ( Č)
( Č cr )
FY17E FY18E
FY17E
FY18E
FY17E
FY18E
FY17E
FY18E
FY17E
FY18E
FY17E
FY18E
FY17E
FY18E
Agri / Agri Chemical
Rallis
Neutral
244
-
4,743
1,937
2,164
13.3
14.3
9.0
11.0
27.1
22.2
4.7
4.1
18.4
19.8
2.5
2.2
United Phosphorus
Neutral
861
-
43,739
15,176
17,604
18.5
18.5
37.4
44.6
23.0
19.3
4.5
3.7
21.4
21.2
3.0
2.5
Auto & Auto Ancillary
Ashok Leyland
Buy
95
111
26,894
20,021
21,915
11.6
11.9
4.5
5.3
21.0
17.8
4.3
3.8
20.6
21.5
1.3
1.2
Bajaj Auto
Neutral
2,844
-
82,295
25,093
27,891
19.5
19.2
143.9
162.5
19.8
17.5
5.5
4.8
30.3
29.4
3.0
2.6
Bharat Forge
Neutral
1,168
-
27,188
7,726
8,713
20.5
21.2
35.3
42.7
33.1
27.4
6.1
5.5
18.9
20.1
3.6
3.1
Eicher Motors
Neutral
28,435
-
77,406
16,583
20,447
17.5
18.0
598.0
745.2
47.6
38.2
16.3
12.4
41.2
38.3
4.5
3.6
Gabriel India
Neutral
131
-
1,877
1,544
1,715
9.0
9.3
5.4
6.3
24.2
20.7
4.6
4.0
18.9
19.5
1.2
1.0
Hero Motocorp
Neutral
3,743
-
74,743
28,083
30,096
15.3
15.7
171.8
187.0
21.8
20.0
7.6
6.4
30.1
27.9
2.5
2.3
Jamna Auto Industries Neutral
257
-
2,045
1,486
1,620
9.8
9.9
15.0
17.2
17.1
14.9
3.7
3.2
21.8
21.3
1.4
1.3
L G Balakrishnan & Bros Neutral
701
-
1,100
1,302
1,432
11.6
11.9
43.7
53.0
16.1
13.2
2.3
2.1
13.8
14.2
0.9
0.9
Mahindra and Mahindra Neutral
1,416
-
87,968
46,534
53,077
11.6
11.7
67.3
78.1
21.0
18.2
3.4
3.0
15.4
15.8
1.9
1.6
Maruti
Neutral
7,215
-
217,948
67,822
83,288
16.0
16.4
253.8
312.4
28.4
23.1
6.5
5.3
23.0
22.9
2.9
2.3
Minda Industries
Neutral
627
-
5,421
2,728
3,042
9.0
9.1
68.2
86.2
9.2
7.3
2.1
1.7
23.8
24.3
2.0
1.8
Motherson Sumi
Neutral
451
-
63,293
45,896
53,687
7.8
8.3
13.0
16.1
34.6
28.0
11.2
8.9
34.7
35.4
1.5
1.2
Rane Brake Lining
Neutral
1,073
-
849
511
562
11.3
11.5
28.1
30.9
38.2
34.7
5.8
5.3
15.3
15.0
1.8
1.7
Setco Automotive
Neutral
39
-
519
741
837
13.0
13.0
15.2
17.0
2.6
2.3
0.4
0.4
15.8
16.3
1.1
1.0
Tata Motors
Neutral
476
-
137,496
300,209
338,549
8.9
8.4
42.7
54.3
11.2
8.8
1.8
1.5
15.6
17.2
0.6
0.5
TVS Motor
Neutral
538
-
25,564
13,390
15,948
6.9
7.1
12.8
16.5
42.2
32.5
10.5
8.3
26.3
27.2
1.9
1.6
Amara Raja Batteries
Buy
874
1,009
14,932
5,305
6,100
16.0
16.3
28.4
34.0
30.8
25.7
5.9
5.0
19.3
19.3
2.8
2.4
Exide Industries
Neutral
230
-
19,533
7,439
8,307
15.0
15.0
8.1
9.3
28.4
24.7
4.0
3.6
14.3
16.7
2.2
2.0
Apollo Tyres
Neutral
228
-
11,626
12,877
14,504
14.3
13.9
21.4
23.0
10.7
9.9
1.7
1.4
16.4
15.2
1.1
1.0
Ceat
Neutral
1,683
-
6,806
7,524
8,624
13.0
12.7
131.1
144.3
12.8
11.7
2.4
2.0
19.8
18.6
1.0
0.9
JK Tyres
Neutral
166
-
3,775
7,455
8,056
15.0
15.0
21.8
24.5
7.6
6.8
1.6
1.3
22.8
21.3
0.6
0.5
Swaraj Engines
Neutral
1,874
-
2,327
660
810
15.2
16.4
54.5
72.8
34.4
25.7
10.7
9.7
31.5
39.2
3.3
2.7
Subros
Neutral
251
-
1,507
1,488
1,681
11.7
11.9
6.4
7.2
39.3
35.1
4.2
3.8
10.8
11.4
1.2
1.1
Indag Rubber
Neutral
206
-
540
286
326
19.8
16.8
11.7
13.3
17.6
15.5
3.0
2.8
17.8
17.1
1.6
1.4
Capital Goods
ACE
Neutral
64
-
634
709
814
4.1
4.6
1.4
2.1
45.8
30.5
1.9
1.8
4.4
6.0
1.1
0.9
BEML
Neutral
1,223
-
5,092
3,451
4,055
6.3
9.2
31.4
57.9
38.9
21.1
2.3
2.1
6.3
10.9
1.6
1.3
Bharat Electronics
Neutral
173
-
38,564
8,137
9,169
16.8
17.2
58.7
62.5
2.9
2.8
0.5
0.4
44.6
46.3
3.7
3.3
Stock Watch
June 01, 2017
Company Name
Reco
CMP
Target
Mkt Cap
Sales ( Čcr )
OPM(%)
EPS (Č)
PER(x)
P/BV(x)
RoE(%)
EV/Sales(x)
(Č)
Price ( Č)
( Č cr )
FY17E
FY18E
FY17E
FY18E
FY17E
FY18E
FY17E
FY18E
FY17E
FY18E
FY17E
FY18E
FY17E
FY18E
Capital Goods
Voltas
Neutral
486
-
16,094
6,511
7,514
7.9
8.7
12.9
16.3
37.7
29.8
6.8
6.0
16.7
18.5
2.2
1.9
BGR Energy
Neutral
161
-
1,164
16,567
33,848
6.0
5.6
7.8
5.9
20.7
27.3
1.2
1.1
4.7
4.2
0.2
0.1
BHEL
Neutral
139
-
33,899
28,797
34,742
-
2.8
2.3
6.9
60.2
20.1
1.0
1.0
1.3
4.8
0.8
0.6
Blue Star
Buy
633
760
6,048
4,283
5,077
5.9
7.3
14.9
22.1
42.5
28.6
8.3
7.0
20.4
26.4
1.5
1.2
CG Power and Industrial
Neutral
83
-
5,180
5,777
6,120
5.9
7.0
3.3
4.5
25.1
18.4
1.1
1.1
4.4
5.9
0.9
0.7
Solutions
Greaves Cotton
Neutral
152
-
3,711
1,755
1,881
16.8
16.9
7.8
8.5
19.5
17.9
3.9
3.6
20.6
20.9
1.8
1.6
Inox Wind
Neutral
136
-
3,025
5,605
6,267
15.7
16.4
24.8
30.0
5.5
4.5
1.5
1.1
25.9
24.4
0.6
0.5
KEC International
Neutral
260
-
6,688
9,294
10,186
7.9
8.1
9.9
11.9
26.3
21.9
3.9
3.3
15.6
16.3
1.0
0.9
KEI Industries
Accumulate
219
239
1,700
2,682
3,058
10.4
10.0
11.7
12.8
18.6
17.1
3.7
3.1
20.1
18.2
0.8
0.7
Thermax
Neutral
1,010
-
12,035
5,421
5,940
7.3
7.3
25.7
30.2
39.3
33.4
4.8
4.3
12.2
13.1
2.1
1.9
VATech Wabag
Neutral
654
-
3,566
3,136
3,845
8.9
9.1
26.0
35.9
25.1
18.2
3.1
2.7
13.4
15.9
1.0
0.8
Cement
ACC
Neutral
1,636
-
30,729
11,225
13,172
13.2
16.9
44.5
75.5
36.8
21.7
3.5
3.2
11.2
14.2
2.7
2.3
Ambuja Cements
Neutral
241
-
47,894
9,350
10,979
18.2
22.5
5.8
9.5
41.6
25.4
3.5
3.1
10.2
12.5
5.1
4.4
India Cements
Neutral
205
-
6,282
4,364
4,997
18.5
19.2
7.9
11.3
25.9
18.1
1.9
1.8
8.0
8.5
2.2
1.9
JK Cement
Neutral
1,109
-
7,756
4,398
5,173
15.5
17.5
31.2
55.5
35.6
20.0
4.3
3.7
12.0
15.5
2.3
1.9
J K Lakshmi Cement
Neutral
491
-
5,778
2,913
3,412
14.5
19.5
7.5
22.5
65.5
21.8
4.0
3.4
12.5
18.0
2.6
2.2
Orient Cement
Neutral
145
-
2,962
2,114
2,558
18.5
20.5
8.1
11.3
17.9
12.8
2.6
2.2
9.0
14.0
2.0
1.6
UltraTech Cement
Neutral
4,197
-
115,215
25,768
30,385
21.0
23.5
111.0
160.0
37.8
26.2
4.8
4.2
13.5
15.8
4.6
3.8
Construction
ITNL
Neutral
103
-
3,377
8,946
10,017
31.0
31.6
8.1
9.1
12.7
11.3
0.5
0.5
4.2
5.0
3.7
3.4
KNR Constructions
Neutral
201
-
2,823
1,385
1,673
14.7
14.0
41.2
48.5
4.9
4.1
0.9
0.8
14.9
15.2
2.1
1.8
Larsen & Toubro
Neutral
1,760
-
164,232
111,017
124,908
11.0
11.0
61.1
66.7
28.8
26.4
3.5
3.2
13.1
12.9
2.5
2.3
Gujarat Pipavav Port
Neutral
150
-
7,235
705
788
52.2
51.7
5.0
5.6
29.9
26.7
3.0
2.7
11.2
11.2
9.9
8.4
Nagarjuna Const.
Neutral
88
-
4,881
8,842
9,775
9.1
8.8
5.3
6.4
16.6
13.7
1.3
1.2
8.2
9.1
0.7
0.6
PNC Infratech
Neutral
147
-
3,776
2,350
2,904
13.1
13.2
9.0
8.8
16.4
16.7
0.6
0.5
15.9
13.9
1.7
1.4
Simplex Infra
Neutral
418
-
2,068
6,829
7,954
10.5
10.5
31.4
37.4
13.3
11.2
1.4
1.3
9.9
13.4
0.7
0.6
Power Mech Projects
Neutral
584
-
860
1,801
2,219
12.7
14.6
72.1
113.9
8.1
5.1
1.5
1.3
16.8
11.9
0.5
0.4
Sadbhav Engineering
Neutral
315
-
5,404
3,598
4,140
10.3
10.6
9.0
11.9
35.0
26.5
3.7
3.2
9.9
11.9
1.8
1.5
NBCC
Neutral
195
-
17,546
7,428
9,549
7.9
8.6
8.2
11.0
23.8
17.7
1.2
0.9
28.2
28.7
2.1
1.6
MEP Infra
Neutral
72
-
1,171
1,877
1,943
30.6
29.8
3.0
4.2
24.0
17.2
11.6
7.8
0.6
0.6
2.0
1.8
Stock Watch
June 01, 2017
Company Name
Reco
CMP
Target
Mkt Cap
Sales ( Čcr )
OPM(%)
EPS (Č)
PER(x)
P/BV(x)
RoE(%)
EV/Sales(x)
(Č)
Price ( Č)
( Č cr )
FY17E
FY18E
FY17E
FY18E
FY17E
FY18E
FY17E
FY18E
FY17E
FY18E
FY17E
FY18E
FY17E
FY18E
Construction
SIPL
Neutral
105
-
3,709
1,036
1,252
65.5
66.2
(8.4)
(5.6)
3.9
4.5
(22.8)
(15.9)
11.8
9.8
Engineers India
Neutral
158
-
10,651
1,725
1,935
16.0
19.1
11.4
13.9
13.9
11.4
1.9
1.9
13.4
15.3
5.1
4.6
Financials
Axis Bank
Accumulate
514
580
123,241
46,932
53,575
3.5
3.4
32.4
44.6
15.9
11.5
2.0
1.8
13.6
16.5
-
-
Bank of Baroda
Neutral
178
-
41,014
19,980
23,178
1.8
1.8
11.5
17.3
15.5
10.3
1.8
1.5
8.3
10.1
-
-
Canara Bank
Neutral
351
-
20,950
15,225
16,836
1.8
1.8
14.5
28.0
24.2
12.5
1.7
1.4
5.8
8.5
-
-
Can Fin Homes
Neutral
2,714
-
7,224
420
526
3.5
3.5
86.5
107.8
31.4
25.2
6.8
5.5
23.6
24.1
-
-
Cholamandalam Inv. &
Buy
1,028
1,230
16,064
2,012
2,317
6.3
6.3
42.7
53.6
24.1
19.2
3.8
3.3
16.9
18.3
-
-
Fin. Co.
Dewan Housing Finance Buy
417
520
13,078
2,225
2,688
2.9
2.9
29.7
34.6
14.1
12.1
2.3
1.5
16.1
14.8
-
-
Equitas Holdings
Buy
156
235
5,281
939
1,281
11.7
11.5
5.8
8.2
26.9
19.1
2.3
2.1
10.9
11.5
-
-
Federal Bank
Accumulate
111
125
19,191
8,259
8,995
3.0
3.0
4.3
5.6
25.9
19.9
2.2
2.0
8.5
10.1
-
-
HDFC
Neutral
1,570
-
249,555
11,475
13,450
3.4
3.4
45.3
52.5
34.7
29.9
6.7
5.9
20.2
20.5
-
-
HDFC Bank
Neutral
1,633
-
418,939
46,097
55,433
4.5
4.5
58.4
68.0
28.0
24.0
4.9
4.1
18.8
18.6
-
-
ICICI Bank
Neutral
326
-
190,151
42,800
44,686
3.1
3.3
18.0
21.9
18.1
14.9
2.5
2.3
11.1
12.3
-
-
Karur Vysya Bank
Buy
116
140
7,007
5,640
6,030
3.3
3.2
8.9
10.0
13.0
11.6
1.4
1.3
11.2
11.4
-
-
Lakshmi Vilas Bank
Neutral
190
-
3,639
3,339
3,799
2.7
2.8
11.0
14.0
17.3
13.6
1.8
1.6
11.2
12.7
-
-
LIC Housing Finance
Neutral
733
-
36,984
3,712
4,293
2.6
2.5
39.0
46.0
18.8
15.9
3.5
3.0
19.9
20.1
-
-
Punjab Natl.Bank
Neutral
150
-
31,941
23,532
23,595
2.3
2.4
6.8
12.6
22.1
11.9
3.4
2.4
3.3
6.5
-
-
RBL Bank
Neutral
528
-
19,833
1,783
2,309
2.6
2.6
12.7
16.4
41.6
32.2
4.5
4.1
12.8
13.3
-
-
Repco Home Finance
Accumulate
784
825
4,905
388
457
4.5
4.2
30.0
38.0
26.1
20.6
4.4
3.7
18.0
19.2
-
-
South Ind.Bank
Neutral
28
-
5,077
6,435
7,578
2.5
2.5
2.7
3.1
10.4
9.1
1.3
1.1
10.1
11.2
-
-
St Bk of India
Neutral
289
-
234,010
88,650
98,335
2.6
2.6
13.5
18.8
21.4
15.4
2.0
1.8
7.0
8.5
-
-
Union Bank
Neutral
156
-
10,690
13,450
14,925
2.3
2.3
25.5
34.5
6.1
4.5
0.9
0.8
7.5
10.2
-
-
Yes Bank
Neutral
1,432
-
65,436
8,978
11,281
3.3
3.4
74.0
90.0
19.4
15.9
3.7
3.1
17.0
17.2
-
-
FMCG
Akzo Nobel India
Neutral
1,800
-
8,633
2,955
3,309
13.3
13.7
57.2
69.3
31.5
26.0
10.3
8.6
32.7
33.3
2.7
2.4
Asian Paints
Neutral
1,153
-
110,557
17,128
18,978
16.8
16.4
19.1
20.7
60.4
55.7
21.0
19.8
34.8
35.5
6.4
5.8
Britannia
Neutral
3,533
-
42,397
9,594
11,011
14.6
14.9
80.3
94.0
44.0
37.6
18.1
14.0
41.2
-
4.3
3.7
Colgate
Neutral
1,012
-
27,537
4,605
5,149
23.4
23.4
23.8
26.9
42.5
37.6
23.6
18.4
64.8
66.8
5.9
5.3
Dabur India
Accumulate
280
304
49,252
8,315
9,405
19.8
20.7
8.1
9.2
34.5
30.4
9.6
8.0
31.6
31.0
5.6
4.9
GlaxoSmith Con*
Neutral
5,282
-
22,214
4,350
4,823
21.2
21.4
179.2
196.5
29.5
26.9
7.8
6.6
27.1
26.8
4.5
4.0
Stock Watch
June 01, 2017
Company Name
Reco
CMP
Target
Mkt Cap
Sales ( Čcr )
OPM(%)
EPS (Č)
PER(x)
P/BV(x)
RoE(%)
EV/Sales(x)
(Č)
Price ( Č)
( Č cr )
FY17E FY18E
FY17E
FY18E
FY17E
FY18E
FY17E
FY18E
FY17E
FY18E
FY17E
FY18E
FY17E
FY18E
FMCG
Godrej Consumer
Neutral
1,811
-
61,685
10,235
11,428
18.4
18.6
41.1
44.2
44.1
41.0
9.8
8.3
24.9
24.8
6.1
5.4
HUL
Neutral
1,067
-
230,893
35,252
38,495
17.8
17.8
20.7
22.4
51.7
47.7
49.4
42.4
95.6
88.9
6.4
5.8
ITC
Neutral
312
-
378,877
40,059
44,439
38.3
39.2
9.0
10.1
34.7
30.8
9.7
8.5
27.8
27.5
9.0
8.1
Marico
Neutral
314
-
40,508
6,430
7,349
18.8
19.5
6.4
7.7
49.1
40.8
14.8
12.5
33.2
32.5
6.1
5.3
Nestle*
Neutral
6,657
-
64,185
10,073
11,807
20.7
21.5
124.8
154.2
53.3
43.2
21.9
19.7
34.8
36.7
6.2
5.3
Tata Global
Neutral
149
-
9,429
8,675
9,088
9.8
9.8
7.4
8.2
20.2
18.2
1.6
1.5
7.9
8.1
1.0
0.9
Procter & Gamble
Neutral
7,452
-
24,190
2,939
3,342
23.2
23.0
146.2
163.7
51.0
45.5
12.9
10.7
25.3
23.5
7.8
6.8
Hygiene
IT
HCL Tech^
Buy
865
1,014
123,477
46,723
52,342
22.1
20.9
60.0
62.8
14.4
13.8
3.7
3.1
25.3
22.4
2.4
2.0
Infosys
Buy
977
1,179
224,400
68,484
73,963
26.0
26.0
63.0
64.0
15.5
15.3
3.3
3.0
20.8
19.7
3.0
2.6
TCS
Neutral
2,544
-
501,346
117,966
127,403
27.5
27.6
134.3
144.5
19.0
17.6
5.6
5.2
29.8
29.7
3.9
3.6
Tech Mahindra
Buy
390
533
38,005
29,141
31,051
14.4
15.0
32.3
35.6
12.1
11.0
2.1
1.9
17.1
17.0
1.2
1.0
Wipro
Accumulate
537
570
130,680
55,421
58,536
20.3
20.3
35.1
36.5
15.3
14.7
2.7
2.3
19.2
14.6
1.8
1.5
Media
D B Corp
Neutral
377
-
6,939
2,297
2,590
27.4
28.2
21.0
23.4
18.0
16.1
4.2
3.6
23.7
23.1
2.8
2.4
HT Media
Neutral
83
-
1,920
2,693
2,991
12.6
12.9
7.9
9.0
10.4
9.2
0.9
0.8
7.8
8.3
0.3
0.2
Jagran Prakashan
Buy
180
225
5,875
2,355
2,635
28.0
28.0
10.8
12.5
16.6
14.4
3.6
3.1
21.7
21.7
2.5
2.2
Sun TV Network
Neutral
800
-
31,529
2,850
3,265
70.1
71.0
26.2
30.4
30.5
26.3
7.8
6.9
24.3
25.6
10.7
9.2
Hindustan Media
Neutral
278
-
2,040
1,016
1,138
24.3
25.2
27.3
30.1
10.2
9.2
1.9
1.7
16.2
15.8
1.3
1.2
Ventures
TV Today Network
Buy
263
344
1,569
567
645
26.7
27.0
15.4
18.1
17.1
14.5
2.6
2.2
14.9
15.2
2.3
2.0
Metals & Mining
Coal India
Neutral
263
-
163,441
84,638
94,297
21.4
22.3
24.5
27.1
10.8
9.7
4.5
4.3
42.6
46.0
1.4
1.3
Hind. Zinc
Neutral
240
-
101,450
14,252
18,465
55.9
48.3
15.8
21.5
15.2
11.2
2.5
2.2
17.0
20.7
7.1
5.5
Hindalco
Neutral
201
-
44,979
107,899
112,095
7.4
8.2
9.2
13.0
21.8
15.4
1.1
1.0
4.8
6.6
0.9
0.9
JSW Steel
Neutral
194
-
46,906
53,201
58,779
16.1
16.2
130.6
153.7
1.5
1.3
0.2
0.2
14.0
14.4
1.6
1.4
NMDC
Neutral
111
-
35,182
6,643
7,284
44.4
47.7
7.1
7.7
15.7
14.4
1.4
1.3
8.8
9.2
3.1
2.7
SAIL
Neutral
57
-
23,603
47,528
53,738
(0.7)
2.1
(1.9)
2.6
22.0
0.6
0.6
(1.6)
3.9
1.4
1.2
Vedanta
Neutral
239
-
88,711
71,744
81,944
19.2
21.7
13.4
20.1
17.8
11.9
1.5
1.4
8.4
11.3
1.6
1.3
Tata Steel
Neutral
505
-
49,037
121,374
121,856
7.2
8.4
18.6
34.3
27.2
14.7
1.7
1.6
6.1
10.1
1.0
1.0
Oil & Gas
GAIL
Neutral
416
-
70,299
56,220
65,198
9.3
10.1
27.1
33.3
15.3
12.5
1.4
1.3
9.3
10.7
1.4
1.2
ONGC
Neutral
177
-
227,213
137,222
152,563
15.0
21.8
19.5
24.1
9.1
7.4
0.8
0.7
8.5
10.1
1.9
1.7
Indian Oil Corp
Neutral
429
-
208,537
373,359
428,656
5.9
5.5
54.0
59.3
8.0
7.2
1.2
1.1
16.0
15.6
0.7
0.6
Stock Watch
June 01, 2017
Company Name
Reco
CMP
Target
Mkt Cap
Sales ( Čcr )
OPM(%)
EPS (Č)
PER(x)
P/BV(x)
RoE(%)
EV/Sales(x)
(Č)
Price ( Č)
( Č cr )
FY17E FY18E
FY17E
FY18E
FY17E
FY18E
FY17E
FY18E
FY17E
FY18E
FY17E
FY18E
FY17E
FY18E
Oil & Gas
Reliance Industries
Neutral
1,341
-
435,887
301,963
358,039
12.1
12.6
87.7
101.7
15.3
13.2
1.6
1.4
10.7
11.3
1.9
1.6
Pharmaceuticals
Alembic Pharma
Buy
538
648
10,137
3,101
3,966
19.7
20.5
21.4
25.5
25.1
21.1
5.3
4.4
23.0
22.8
3.2
2.4
Alkem Laboratories Ltd
Accumulate
1,932
2,161
23,094
5,853
6,901
17.1
18.4
74.6
85.0
25.9
22.7
5.5
4.6
21.1
20.2
3.9
3.3
Aurobindo Pharma
Buy
574
877
33,638
15,720
18,078
23.7
23.7
41.4
47.3
13.9
12.1
3.6
2.8
29.6
26.1
2.4
2.0
Aventis*
Neutral
4,060
-
9,351
2,206
2,508
16.6
16.8
128.9
139.9
31.5
29.0
5.4
4.2
21.6
23.5
4.0
3.3
Cadila Healthcare
Neutral
465
-
47,558
10,429
12,318
17.7
21.6
13.1
19.2
35.5
24.2
7.4
5.9
22.8
27.1
4.6
3.8
Cipla
Reduce
515
465
41,402
15,378
18,089
15.7
16.8
19.3
24.5
26.7
21.0
3.1
2.8
12.3
13.9
2.9
2.4
Dr Reddy's
Neutral
2,518
-
41,723
14,081
15,937
16.1
18.6
72.6
105.9
34.7
23.8
3.4
3.1
9.6
13.6
3.2
2.8
Dishman Pharma
Sell
143
1,718
1,890
22.7
22.8
9.5
11.3
10.1
10.9
3.3
2.9
GSK Pharma*
Neutral
2,427
-
20,558
2,927
3,290
11.8
16.2
34.4
49.6
70.6
48.9
10.3
10.7
13.9
21.3
6.8
6.1
Indoco Remedies
Buy
184
240
1,699
1,112
1,289
16.2
18.2
11.6
16.0
15.9
11.5
2.5
2.1
17.0
20.1
1.7
1.4
Ipca labs
Buy
491
613
6,196
3,258
3,747
12.8
15.3
12.1
19.2
40.6
25.6
2.5
2.3
6.4
9.5
2.0
1.8
Lupin
Buy
1,161
1,809
52,448
15,912
18,644
26.4
26.7
58.1
69.3
20.0
16.8
3.9
3.2
21.4
20.9
3.4
2.7
Natco Pharma
Neutral
934
-
16,275
2,090
2,335
32.1
26.6
26.8
23.2
34.8
40.3
9.9
8.5
28.4
21.1
7.9
96.4
Sun Pharma
Buy
501
847
120,297
31,129
35,258
32.0
32.9
30.2
35.3
16.6
14.2
2.7
2.2
20.0
20.1
3.4
2.8
Power
Tata Power
Neutral
81
-
21,909
36,916
39,557
17.4
27.1
5.1
6.3
15.9
12.9
1.4
1.3
9.0
10.3
1.6
1.4
NTPC
Neutral
160
-
131,969
86,605
95,545
17.5
20.8
11.8
13.4
13.6
11.9
1.4
1.3
10.5
11.1
2.9
2.9
Power Grid
Accumulate
208
223
108,712
25,315
29,193
88.2
88.7
14.2
17.2
14.7
12.1
2.2
1.9
15.2
16.1
8.9
8.0
Real Estate
Prestige Estate
Neutral
242
-
9,079
4,707
5,105
25.2
26.0
10.3
13.0
23.5
18.6
1.9
1.8
10.3
10.2
3.1
2.8
MLIFE
Buy
427
522
2,189
1,152
1,300
22.7
24.6
29.9
35.8
14.3
11.9
1.1
1.0
7.6
8.6
2.6
2.2
Telecom
Bharti Airtel
Neutral
372
-
148,623
105,086
114,808
34.5
34.7
12.2
16.4
30.5
22.7
2.1
1.9
6.8
8.4
2.3
2.0
Idea Cellular
Neutral
80
-
28,864
40,133
43,731
37.2
37.1
6.4
6.5
12.5
12.3
1.0
1.0
8.2
7.6
1.7
1.5
zOthers
Abbott India
Neutral
4,162
-
8,843
3,153
3,583
14.1
14.4
152.2
182.7
27.3
22.8
134.3
114.6
25.6
26.1
2.5
2.2
Asian Granito
Accumulate
374
405
1,127
1,060
1,169
12.2
12.5
12.7
15.9
29.6
23.6
2.8
2.5
9.5
10.7
1.4
1.2
Bajaj Electricals
Buy
342
395
3,461
4,801
5,351
5.7
6.2
10.4
13.7
32.8
25.0
4.1
3.6
12.4
14.5
0.7
0.6
Banco Products (India)
Neutral
216
-
1,547
1,353
1,471
12.3
12.4
14.5
16.3
14.9
13.3
20.6
18.6
14.5
14.6
1.1
116.4
Coffee Day Enterprises
Neutral
248
-
5,106
2,964
3,260
20.5
21.2
4.7
8.0
-
31.0
2.9
2.6
5.5
8.5
2.1
1.9
Ltd
Competent Automobiles Neutral
194
-
124
1,137
1,256
3.1
2.7
28.0
23.6
6.9
8.2
37.2
33.6
14.3
11.5
0.1
0.1
Elecon Engineering
Neutral
64
-
718
1,482
1,660
13.7
14.5
3.9
5.8
16.4
11.0
3.9
3.5
7.8
10.9
0.8
0.7
Stock Watch
June 01, 2017
Company Name
Reco
CMP
Target
Mkt Cap
Sales ( Čcr )
OPM(%)
EPS (Č)
PER(x)
P/BV(x)
RoE(%)
EV/Sales(x)
(Č)
Price ( Č)
( Č cr )
FY17E
FY18E
FY17E
FY18E
FY17E
FY18E
FY17E
FY18E
FY17E
FY18E
FY17E
FY18E
FY17E
FY18E
zOthers
Finolex Cables
Neutral
504
-
7,714
2,883
3,115
12.0
12.1
14.2
18.6
35.5
27.1
18.9
16.5
15.8
14.6
2.4
2.1
Garware Wall Ropes
Neutral
795
-
1,740
863
928
15.1
15.2
36.4
39.4
21.8
20.2
4.0
3.4
17.5
15.9
1.9
1.8
Goodyear India*
Neutral
812
-
1,872
1,598
1,704
10.4
10.2
49.4
52.6
16.4
15.4
75.9
66.5
18.2
17.0
0.9
121.0
Hitachi
Neutral
2,075
-
5,642
2,081
2,433
8.8
8.9
33.4
39.9
62.1
52.0
50.1
41.8
22.1
21.4
2.7
2.3
HSIL
Neutral
340
-
2,455
2,384
2,515
15.8
16.3
15.3
19.4
22.2
17.5
22.1
19.0
7.8
9.3
1.2
1.1
Interglobe Aviation
Neutral
1,107
-
40,011
21,122
26,005
14.5
27.6
110.7
132.1
10.0
8.4
59.8
42.7
168.5
201.1
1.9
1.5
Jyothy Laboratories
Neutral
367
-
6,659
1,440
2,052
11.5
13.0
8.5
10.0
43.1
36.7
10.4
9.7
18.6
19.3
4.9
3.4
Kirloskar Engines India
Neutral
385
-
5,568
2,554
2,800
9.9
10.0
10.5
12.1
36.7
31.8
15.3
14.5
10.7
11.7
1.8
1.6
Ltd
Linc Pen & Plastics
Neutral
267
-
395
382
420
9.3
9.5
13.5
15.7
19.8
17.0
3.4
2.9
17.1
17.3
1.1
1.0
M M Forgings
Neutral
621
-
749
546
608
20.4
20.7
41.3
48.7
15.0
12.7
85.0
75.2
16.6
17.0
1.2
1.1
Manpasand Bever.
Neutral
800
-
4,577
836
1,087
19.6
19.4
16.9
23.8
47.3
33.6
5.7
5.0
12.0
14.8
5.2
3.9
Mirza International
Neutral
147
-
1,762
963
1,069
17.2
18.0
6.1
7.5
23.9
19.5
3.7
3.1
15.0
15.7
2.0
1.8
MT Educare
Neutral
61
-
244
366
417
17.7
18.2
9.4
10.8
6.5
5.7
1.5
1.3
22.2
22.3
0.6
0.5
Narayana Hrudaya
Neutral
330
-
6,735
1,873
2,166
11.5
11.7
2.6
4.0
124.6
83.1
7.6
6.9
6.1
8.3
3.7
3.2
Navkar Corporation
Buy
218
265
3,115
369
561
42.9
42.3
6.9
11.5
31.6
19.0
2.2
2.0
7.4
10.5
9.5
6.2
Navneet Education
Neutral
185
-
4,320
1,062
1,147
24.0
24.0
6.1
6.6
30.4
27.9
6.2
5.5
20.6
19.8
4.1
3.8
Nilkamal
Neutral
2,007
-
2,994
1,995
2,165
10.7
10.4
69.8
80.6
28.8
24.9
114.7
99.6
16.6
16.5
1.5
1.3
Page Industries
Neutral
14,352
-
16,008
2,450
3,124
20.1
17.6
299.0
310.0
48.0
46.3
319.7
244.0
47.1
87.5
6.6
5.2
Parag Milk Foods
Neutral
237
-
1,997
1,919
2,231
9.3
9.6
9.5
12.9
25.1
18.4
3.9
3.2
15.5
17.5
1.2
1.0
Quick Heal
Neutral
209
-
1,466
408
495
27.3
27.0
7.7
8.8
27.0
23.8
2.5
2.5
9.3
10.6
2.7
2.3
Radico Khaitan
Buy
120
147
1,591
1,667
1,824
13.0
13.2
6.7
8.2
18.0
14.6
1.6
1.5
9.0
10.2
1.3
1.2
Relaxo Footwears
Neutral
466
-
5,598
2,085
2,469
9.2
8.2
7.6
8.0
61.6
58.6
23.9
20.4
17.9
18.8
2.8
2.4
S H Kelkar & Co.
Neutral
283
-
4,090
1,036
1,160
15.1
15.0
6.1
7.2
46.3
39.4
5.0
4.5
10.7
11.5
3.8
3.4
Siyaram Silk Mills
Neutral
1,898
-
1,780
1,652
1,857
11.6
11.7
92.4
110.1
20.5
17.2
3.0
2.6
14.7
15.2
1.3
1.1
Styrolution ABS India*
Neutral
768
-
1,351
1,440
1,537
9.2
9.0
40.6
42.6
18.9
18.0
48.3
43.9
12.3
11.6
0.9
0.8
Surya Roshni
Neutral
281
-
1,233
3,342
3,625
7.8
7.5
17.3
19.8
16.3
14.2
30.9
24.8
10.5
10.8
0.6
0.6
Team Lease Serv.
Neutral
1,167
-
1,995
3,229
4,001
1.5
1.8
22.8
32.8
51.3
35.5
5.5
4.8
10.7
13.4
0.5
0.4
The Byke Hospitality
Neutral
190
-
762
287
384
20.5
20.5
7.6
10.7
25.0
17.8
5.2
4.2
20.7
23.5
2.7
2.0
Transport Corporation of
Neutral
296
-
2,265
2,671
2,911
8.5
8.8
13.9
15.7
21.3
18.9
2.9
2.6
13.7
13.8
1.0
0.9
India
Stock Watch
June 01, 2017
Company Name
Reco
CMP
Target Mkt Cap
Sales ( Čcr )
OPM(%)
EPS (Č)
PER(x)
P/BV(x)
RoE(%)
EV/Sales(x)
(Č)
Price ( Č)
( Č cr )
FY17E FY18E FY17E FY18E FY17E FY18E FY17E FY18E FY17E FY18E FY17E FY18E FY17E FY18E
zOthers
TVS Srichakra
Neutral
4,043
-
3,096
2,304
2,614
13.7
13.8
231.1
266.6
17.5
15.2
454.3
357.7
33.9
29.3
1.3
1.2
UFO Moviez
Neutral
380
-
1,049
619
685
33.2
33.4
30.0
34.9
12.7
10.9
1.8
1.5
13.8
13.9
1.4
1.1
Visaka Industries
Neutral
392
-
623
1,051
1,138
10.3
10.4
21.0
23.1
18.7
16.9
50.3
47.1
9.0
9.2
0.9
0.8
VRL Logistics
Neutral
318
-
2,902
1,902
2,119
16.7
16.6
14.6
16.8
21.8
18.9
4.8
4.2
21.9
22.2
1.6
1.4
VIP Industries
Accumulate
193
218
2,721
1,270
1,450
10.4
10.4
5.6
6.5
34.4
29.6
7.1
6.2
20.7
21.1
2.1
1.9
Navin Fluorine
Buy
2,930
3,650
2,869
789
945
21.1
22.4
120.1
143.4
24.4
20.4
3.9
3.4
17.8
18.5
3.6
2.9
Source: Company, Angel Research; Note: *December year end; #September year end; &October year end; Price as on May 31, 2017
Market Outlook
June 01, 2017
Research Team Tel: 022 - 39357800
DISCLAIMER
Angel Broking Private Limited (hereinafter referred to as “Angel”) is a registered Member of National Stock Exchange of India
Limited,Bombay Stock Exchange Limited and Metropolitan Stock Exchange Limited. It is also registered as a Depository Participant with
CDSL and Portfolio Manager with SEBI. It also has registration with AMFI as a Mutual Fund Distributor. Angel Broking Private Limited is a
registered entity with SEBI for Research Analyst in terms of SEBI (Research Analyst) Regulations, 2014 vide registration number
INH000000164. Angel or its associates has not been debarred/ suspended by SEBI or any other regulatory authority for accessing
/dealing in securities Market. Angel or its associates/analyst has not received any compensation / managed or
co-managed public offering of securities of the company covered by Analyst during the past twelve months.
This document is solely for the personal information of the recipient, and must not be singularly used as the basis of any investment
decision. Nothing in this document should be construed as investment or financial advice. Each recipient of this document should make
such investigations as they deem necessary to arrive at an independent evaluation of an investment in the securities of the companies
referred to in this document (including the merits and risks involved), and should consult their own advisors to determine the merits and
risks of such an investment.
Reports based on technical and derivative analysis center on studying charts of a stock's price movement, outstanding positions and
trading volume, as opposed to focusing on a company's fundamentals and, as such, may not match with a report on a company's
fundamentals. Investors are advised to refer the Fundamental and Technical Research Reports available on our website to evaluate the
contrary view, if any.
The information in this document has been printed on the basis of publicly available information, internal data and other reliable
sources believed to be true, but we do not represent that it is accurate or complete and it should not be relied on as such, as this
document is for general guidance only. Angel Broking Pvt. Limited or any of its affiliates/ group companies shall not be in any way
responsible for any loss or damage that may arise to any person from any inadvertent error in the information contained in this report.
Angel Broking Pvt. Limited has not independently verified all the information contained within this document. Accordingly, we cannot
testify, nor make any representation or warranty, express or implied, to the accuracy, contents or data contained within this document.
While Angel Broking Pvt. Limited endeavors to update on a reasonable basis the information discussed in this material, there may be
regulatory, compliance, or other reasons that prevent us from doing so.
This document is being supplied to you solely for your information, and its contents, information or data may not be reproduced,
redistributed or passed on, directly or indirectly.
Neither Angel Broking Pvt. Limited, nor its directors, employees or affiliates shall be liable for any loss or damage that may arise from
or in connection with the use of this information.